

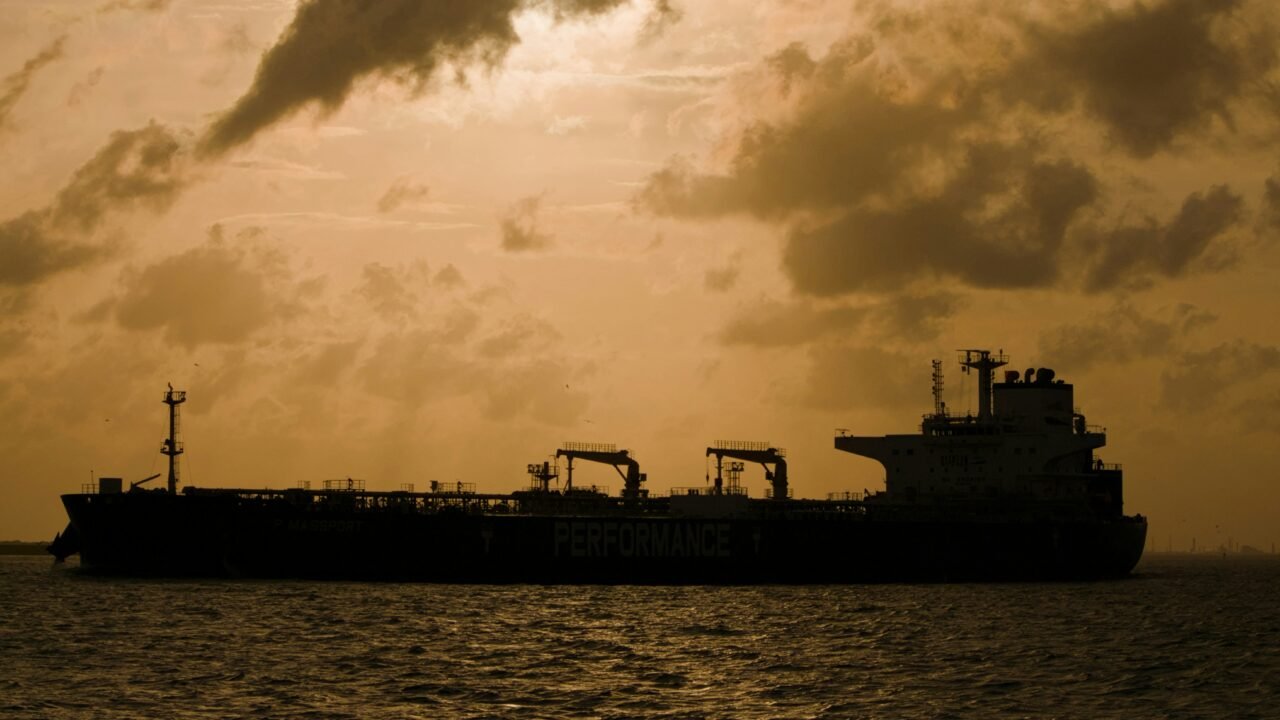
Six months into 2026, the global economy is absorbing what the International Energy Agency (IEA) and S&P Global have both described as the largest oil supply disruption on record. Global growth forecasts have been marked down across the IMF, World Bank, and private-sector shops; inflation has reignited just as central banks were declaring victory; and equity markets have swung through some of the sharpest volatility spikes since 2022.
Heading into 2026, the global economy was on a modest recovery path, with merchandise trade finally clawing back momentum after the disruptions of the pandemic and the Russia-Ukraine war. That recovery was interrupted abruptly in late February, when a supply shock hit oil markets from a source many traders had been watching warily for months: a full-scale war breaking out around the Strait of Hormuz.
The trigger was a joint military operation — codenamed “Operation Epic Fury” — in which Israel and The United States struck Iran’s nuclear enrichment facilities, ballistic missile infrastructure, and military leadership on February 28, including strikes that killed Supreme Leader Ali Khamenei along with other senior officials. Iran responded with missile and drone strikes on Israel and US regional assets, and the conflict widened within days to draw in Hezbollah in Lebanon, the Houthis in Yemen, and Iran-aligned militias in Iraq. Within days, the Strait of Hormuz was effectively closed, triggering the sharpest energy supply shock most traders have seen in their careers.
History’s yardstick
For readers benchmarking this against previous oil-driven shocks, 2026 sits in a well-established but rare category: a Middle East-originated supply shock big enough to move global growth and inflation forecasts, not merely regional ones. In pure barrels-affected terms, the “largest on record” claim holds up against the historical data. The 1973 Arab oil embargo removed roughly 4.5m barrels a day from world supply, and the 1978-79 Iranian revolution took out roughly 5.6m barrels a day. By contrast, the Strait of Hormuz closure has halted transit of more than 20m barrels a day—around a fifth of global petroleum consumption, and the IEA formally assessed the closure as the largest disruption to global oil markets in history in March 2026, prompting member countries to release a record 400m barrels from strategic reserves. S&P Global’s head of crude-oil market research has separately called it the largest disruption on record for the oil market, and Eurasia Group’s Gregory Brew has put the scale at roughly double the previous largest shock.
A caveat is in order, though. The 1973 and 1979 shocks still hold the record for relative price impact: crude nearly quadrupled in 1973 and more than doubled in 1979-80, whereas Brent’s move this year (from roughly $66 to just above $100 a barrel at the March peak, a rise of 50-70 percent) has so far been proportionally smaller. That is partly thanks to the much larger strategic reserves and more diversified supply base that were built specifically in response to those earlier crises. In other words: a bigger disruption by volume, landing on a rather more resilient system—which turns out to be a large part of the market story that follows.
The 1990 Gulf war is a closer parallel in mechanism (a Gulf-based conflict threatening tanker traffic) but was smaller in absolute terms; Russia’s 2022 invasion of Ukraine is the closest modern analogue in structure, a major energy exporter’s supply pulled offline by war, though Russia’s importance to global energy markets and Iran’s or the Gulf’s are not quite the same thing.
What distinguishes 2026 is the chokepoint dynamic. Unlike Russian pipeline gas which could be substituted via LNG and alternative suppliers, the Strait of Hormuz and the Bab el-Mandeb strait cannot be easily replaced. When both are threatened at once, as happened in July when Houthi threats to block Saudi shipping through Bab el-Mandeb compounded the Hormuz closure, there is no quick substitute, only re-routing via the Cape of Good Hope at greater cost and over longer transit times.
The oil channel
Energy has been the primary channel through which the conflict has hit the world economy. Brent crude, which had been trading in a relatively calm range of $60-$70 in early 2026, surged to an intraday peak of $119.50 a barrel on March 9th as strikes on Iranian energy infrastructure intensified fears of a prolonged Hormuz closure. Some Saudi Aramco projections at the height of the crisis reportedly warned prices could surge past $180 a barrel had disruption continued through late April.
Prices eased considerably after America and Iran signed a memorandum of understanding in mid-June aimed at ending the conflict and reopening the strait: Brent fell to an average of $85 in June and briefly dipped below $70 by July 1st, nearly back to pre-conflict levels. That calm proved short-lived. Renewed American strikes on Iran and a Houthi threat to block Saudi shipping through Bab el-Mandeb—a strait carrying roughly 7% of global oil output—pushed prices back into the low-to-mid $80s by late July.
The knock-on effects have been broad: higher shipping-insurance premiums, a scramble for alternative export routes and, notably, a meaningful drop in global oil demand as high fuel costs and government rationing curbed consumption, particularly across Asia. America’s Energy Information Administration forecasts that global oil consumption will fall by an average of 1.2m barrels a day in 2026, with two-thirds of that decline coming from non-OECD countries.
The Macroeconomic Impact
Every big forecaster has revised its 2026 outlook downwards. The IMF now projects global growth slowing to roughly 3%. The World Bank has gone further, warning the conflict could push global growth to its lowest rate since the covid-19 pandemic, with Gulf economies directly in the conflict zone seeing growth collapse from roughly 3.9% in 2025 to near zero in 2026.
The pain is not evenly spread. Modelling from the Peterson Institute suggests America, despite its energy independence, still sees 2026 GDP roughly 1.2% lower than baseline, concentrated in transport, agriculture and durable manufacturing. China growth is expected to be lower by 1.8% — not because of direct energy exposure but mainly because slowing global demand hits its export-driven economy.
Emerging markets and developing economies are absorbing the deepest damage. Higher fertiliser costs, a secondary effect of the energy shock, are hitting agricultural output disproportionately hard in economies where farming makes up a larger share of GDP. The World Bank warns that, absent a durable resolution, developing economies outside China and India could see nearly a decade of stalled progress in closing the income gap with rich countries. In response, the World Bank has mobilised $50bn-60bn in emergency financing, including $25bn in pre-arranged support.
Just as the global economy appeared to be emerging from the inflation cycle, the energy shock gave price growth a fresh push. The OECD has forecast G20 inflation running at around 4% in 2026, and Fitch and others have cut global-growth projections by as much as 0.8 percentage points on the back of sustained high energy costs. In America headline inflation has been pushed temporarily towards 4%, eroding real incomes even as core inflation has risen more moderately on the assumption that the energy disruption proves temporary. The practical effect has been to force central banks to pause or reverse interest rate cuts.
Shocks and recoveries
For an economics-minded reader, the equity story is arguably the most counter-intuitive part of this shock: despite a war, an oil spike and downgraded growth forecasts, global indices have shown remarkable resilience, punctuated by real and sharp drawdowns.
The initial shock was severe. In the first days of the war the S&P 500 fell sharply, wiping out its gains for the year as investors rotated into defensive positions. By March 13th the VIX had surged by 12.6% in a single session to 27.29, its highest level since the geopolitical shocks of 2022, indicating a global fear of free falling stock prices.
Yet the recovery has been unusually fast. After a roughly 9% peak-to-trough decline tied to the war, the S&P 500 staged one of its quickest recoveries in 36 years, and by mid-April American stocks were hitting record highs—the S&P 500 closing above 7,000 for the first time—despite the ongoing war, an active oil-supply shock and forecasts of stunted global growth. Mark Zandi and other economists attribute part of this resilience to AI and technology stocks, which account for close to half the S&P 500’s market capitalisation and have largely traded on their own fundamentals, independent of the war.
Volatility has continued in waves tied to headlines rather than any single sustained trend. A five-day postponement of strikes on Iranian energy infrastructure on March 23rd sparked a relief rally, with the S&P 500 rising about 1.2%. Conversely, when President Trump declared the American-Iranian ceasefire “over” in early July following renewed attacks, markets whipsawed before stabilising; by July 8th the Nasdaq had gained 1.3% and the S&P 500 0.81% in a single session, helped by falling oil prices and a rally in semiconductor stocks, even as investors described the macroeconomic backdrop as “highly inflationary and highly uncertain.” European and Asian equities have moved in tandem on the same headline cycles—the Stoxx 600, the Nikkei and the CSI 300 have all posted comparable single-session swings around the same news flow.
Sector rotation has been the clearer signal than the direction of the index. Defence contractors—Lockheed Martin, Northrop Grumman—rallied to all-time highs early in the conflict on expectations of higher demand for missile defence and munitions. Energy and airline stocks have moved inversely with the oil price. Renewable-energy and cyber-security names have periodically attracted flows as investors hedge against both fossil-fuel supply risk and the cyberwarfare dimension of the conflict.
The response to the war has not been purely defensive. Saudi Arabia has accelerated its pivot towards land-based export pipelines and new international logistics corridors to reduce its reliance on the Strait of Hormuz, and Dubai and Qatar have rolled out emergency liquidity and business-support packages. Iraqi crude exports more than doubled in the first half of July as shippers routed around the most contested waters. The crisis has, if anything, strengthened the long-term case for renewables and energy diversification, even as many governments have leaned on short-term fossil-fuel measures, including reverting to coal and offering emergency drilling incentives, to manage the immediate crunch.
What happens next
The honest picture, as of late July 2026, is one of a serious but not catastrophic global slowdown layered on top of unusually resilient equity markets. Growth has been cut meaningfully rather than reversed outright; inflation has been reignited rather than sent spiraling; and global equities have, so far, treated the war as a volatility event rather than an earnings or solvency one.
The outlook for the global economy now depends almost entirely on developments in the Middle East. Whether the overall picture stabilises into a manageable, temporary shock or deteriorates into something closer to a genuine global downturn depends almost entirely on developments still unfolding.